
Build a UX Metrics Dashboard
Introduction
This tutorial shows how to use the Results API QXscore endpoint to build a UX metrics dashboard that tracks experience quality across tests and time.
QXscore is a composite benchmark metric that combines behavioral and attitudinal signals, making it ideal for dashboards, trend analysis, and executive reporting.
QXscores are calculated through interaction test data.
What you’ll build
A dashboard-ready data flow that:
- Retrieves QXscores for a test
- Understands QXscore structure and components
- Normalizes QXscore data for BI tools
- Enables trend and comparison views across tests
Target audience
- Product managers
- UX researchers
- Analytics and BI engineers
- Research operations teams
Prerequisites
- A valid access token (
ACCESS_TOKEN). Go to Authorization for details. - A known
testId. Go to How to obtain a Test ID (UUID) for details. - A BI or visualization tool (Tableau, Looker, Power BI, etc.)
What is QXscore?
A QXscore is a standardized metric (0–100) that evaluates experience quality by combining:
Behavioral component
- Derived from navigational task success
- Measures what participants did
Attitudinal component
- Derived from questionnaire responses
- Measures what participants felt
- Divided into four categories:
- Usability
- Trust
- Appearance
- Loyalty
Each test can contain one or more QX task groups, each producing a QXscore. Task groups contain at least two tasks each.
The QXscore endpoint returns aggregated data only. This means that returned scores are an average of all participant sessions .
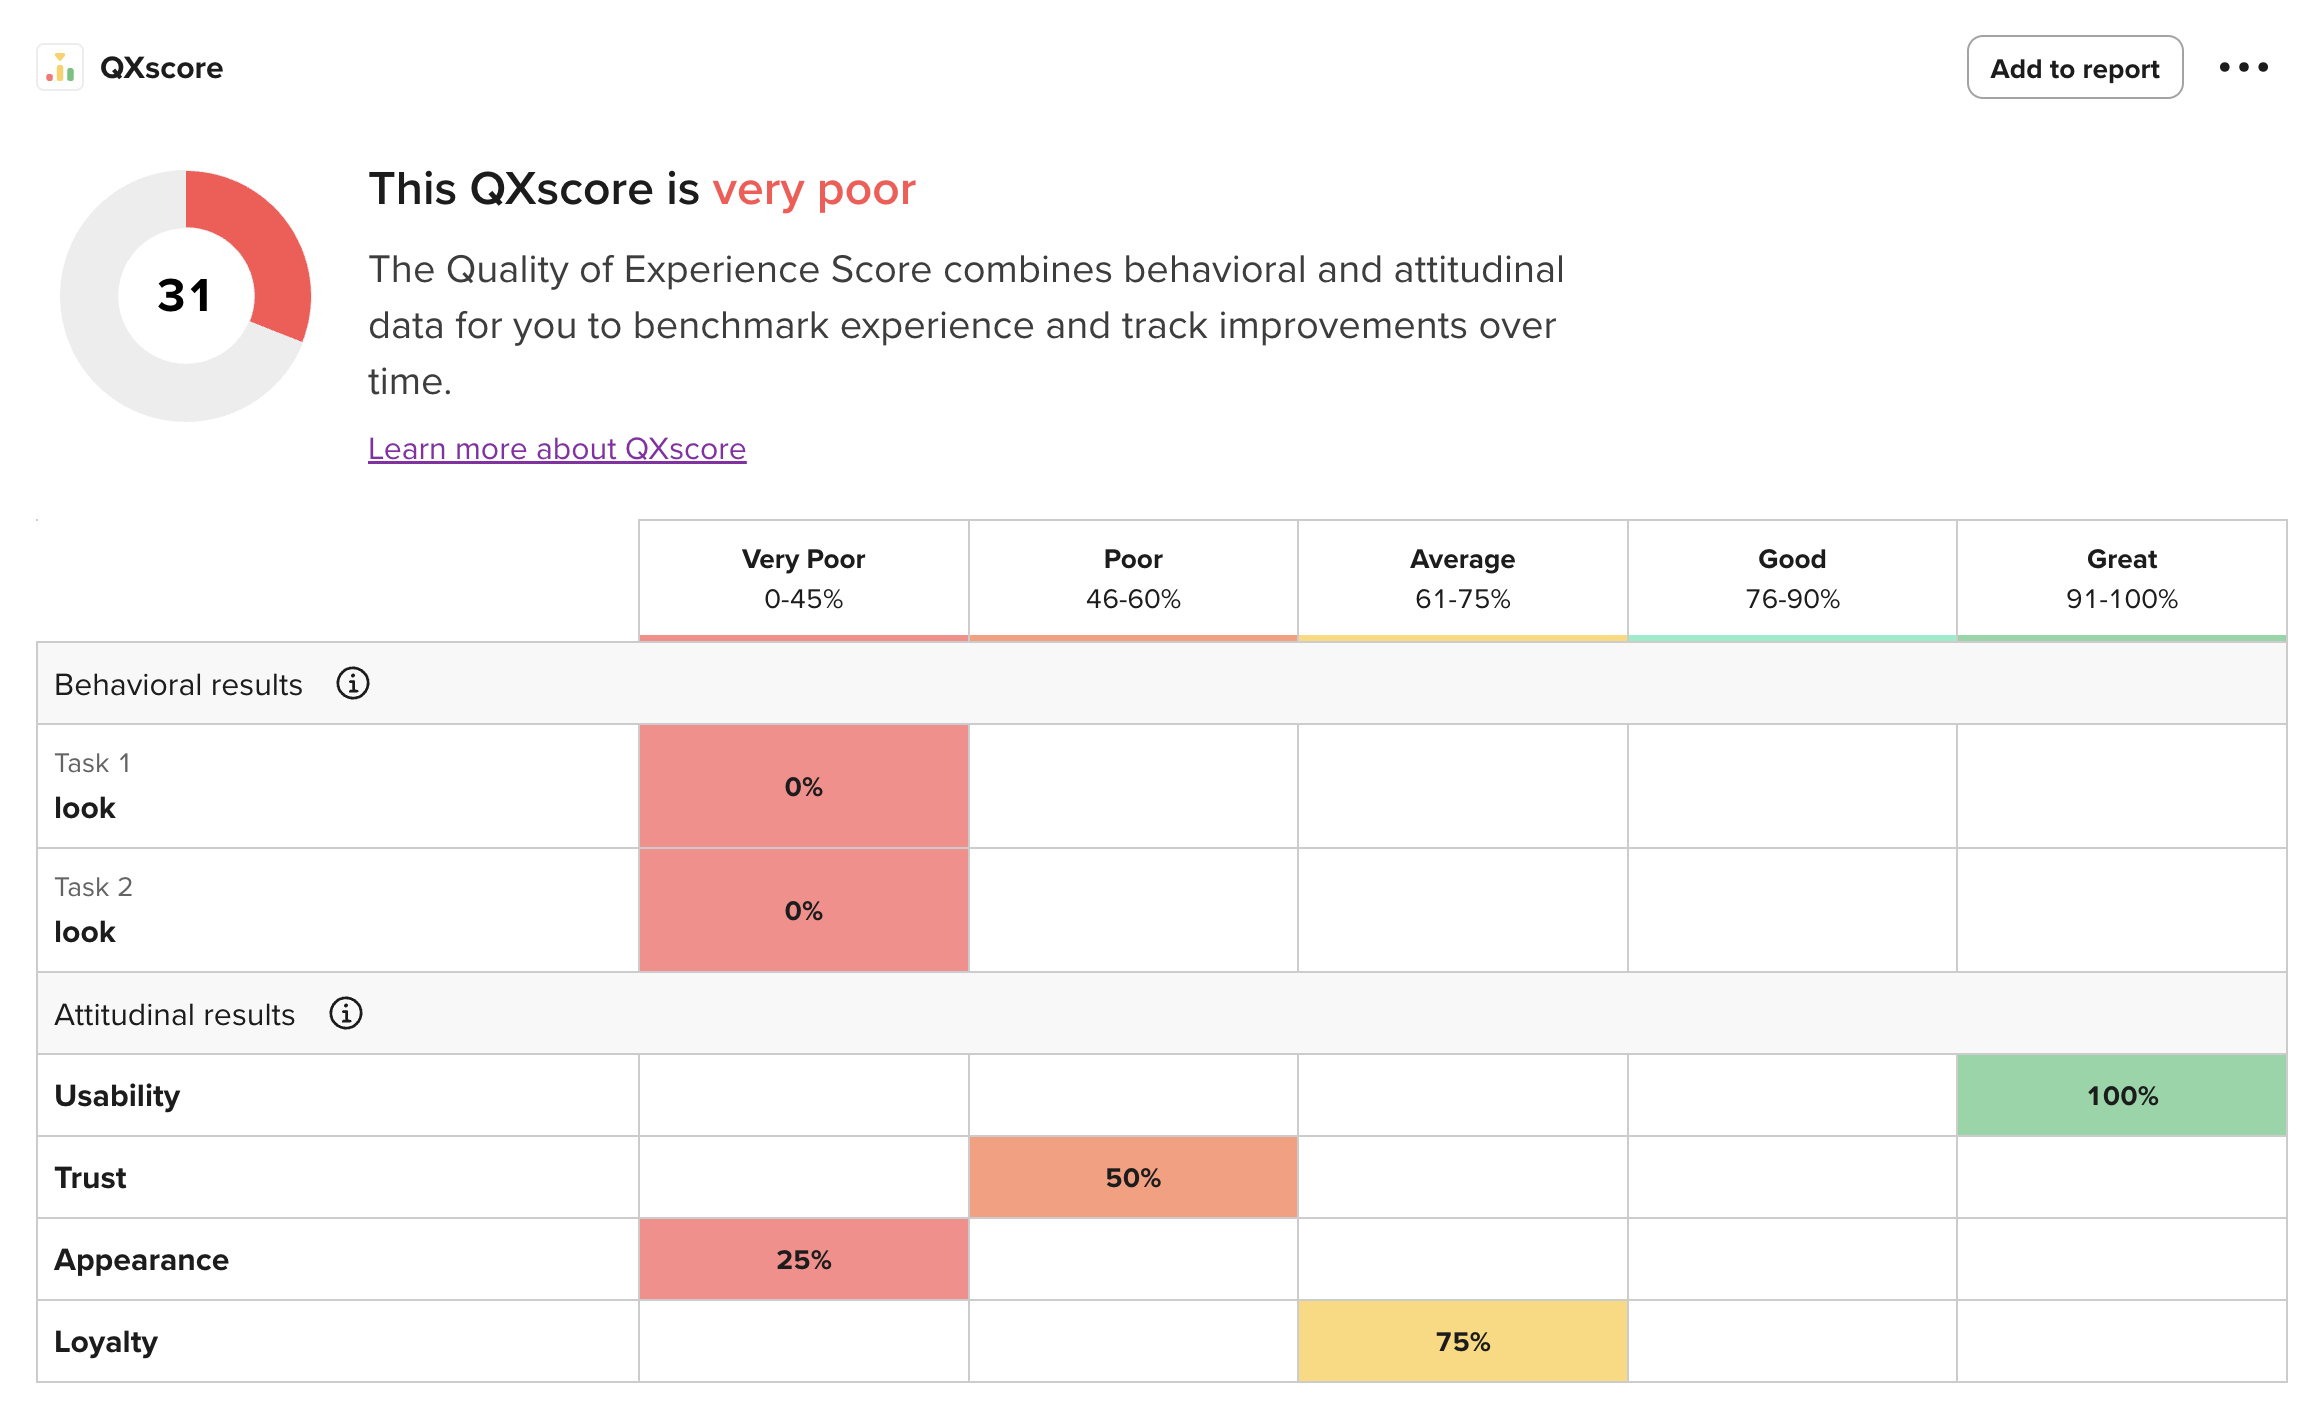
QXscore table as seen on UserTesting UI
Steps
Step 1 — Retrieve QXscores for a test
Endpoint
GET /api/v2/testResults/TEST_ID/qxScores
What this returns
- One or more QX task groups
- Aggregate scores across completed sessions
- Component-level and subcomponent-level values
Example (curl)
curl --location 'https://api.use2.usertesting.com/api/v2/testResults/TEST_ID/qxScores' \
  --header 'Authorization: Bearer ACCESS_TOKEN' \
  --header 'Content-Type: application/json'
Step 2 — Understand the response structure
Top-level fields
{
  "testId": "TEST_ID",
  "qxScores": [...],
  "meta": {
    "totalQxTasks": 1,
    "completes": 12
  }
}testId: indicates the test ID (interaction tests only)meta.completes: indicates the number of completed sessions used in scoring
QX task group structure
Each entry in qxScores[] represents one QX task group.
{
  "taskGroupId": "TASK_GROUP_ID",
  "label": "QXscore 1",
  "qxScore": 38,
  "components": {
    "behavioral": 25,
    "attitudinal": 50
  },
  "values": {
    "behavioral": [50, 50],
    "usability": 50,
    "trust": 50,
    "appearance": 50,
    "loyalty": 50
  }
}qxScore: the task group's QXscore, calculated by the average of the behavioral and attitudinal values found in thecomponentsproperty.components.behavioral: indicates the average obtained from the navigational task scores invalues.behavioral, which display the session average for each taskcomponents.attitudinal: indicates the average obtained fromvalues.usability,values.trust,values.appearance, andvalues.loyalty, which indicate the session average for each questionnaire category
Step 3 — Model QXscore data for analytics
Recommended warehouse table: qx_scores
| Column | Description |
|---|---|
| test_id | UUID of the interaction test |
| task_group_id | QX task group UUID |
| label | QX task group label |
| qx_score | Overall QXscore (0–100) |
| behavioral_score | Behavioral component |
| attitudinal_score | Attitudinal component |
| usability | Attitudinal sub-score |
| trust | Attitudinal sub-score |
| appearance | Attitudinal sub-score |
| loyalty | Attitudinal sub-score |
| completes | Number of sessions included |
| extracted_at | Timestamp of ingestion |
Step 4 — Create dashboard views
Once loaded into a BI tool, QXscore enables several high-value UX views.
-
Overall UX health
- Metric tile showing latest QXscore
- Compared against internal benchmarks
-
Behavioral vs attitudinal split
- Stacked bar or dual-axis chart
- Identifies execution vs perception gaps
-
Subcomponent breakdown
- Radar or bar chart for:
- Usability
- Trust
- Appearance
- Loyalty
- Radar or bar chart for:
-
Longitudinal trends
- QXscore by test launch date
- Track improvement over time
Step 5 — Compare across tests or releases
By storing QXscores per test, teams can:
- Compare redesign A vs redesign B
- Track UX impact across releases
- Correlate QXscore with:
- Conversion
- Retention
- NPS
- Support tickets
Error handling
Take into consideration the following:
- For scheduling, consider placing automated retries and notifications if you encounter a 503 error.
- Consider placing backoff logic on 429 error responses.
Common pitfalls
| Pitfall | Recommendation |
|---|---|
| Mixing task groups | Treat each taskGroupId independently |
| Overinterpreting small samples | Use meta.completes as context |
What you can build next
With QXscore data in place, teams can:
- Combine UX and product analytics in BI tools
- Power executive dashboards with experience metrics
- Feed scores into AI systems for automated insights
- Detect UX regressions early
Summary
You now have a clean, scalable way to:
- Retrieve standardized UX quality metrics
- Store them in analytics-friendly formats
- Visualize experience quality across tests and time
QXscore dashboards turn qualitative research into quantifiable, trackable UX signals that organizations can act on with confidence.